Designs
Experimental styles for MapLibre basemaps and data layers. Each design is a self-contained folder: a style, an optional overlay, and a note on what it is trying. Open one, then use the arrow keys to move between them.
1 World fields
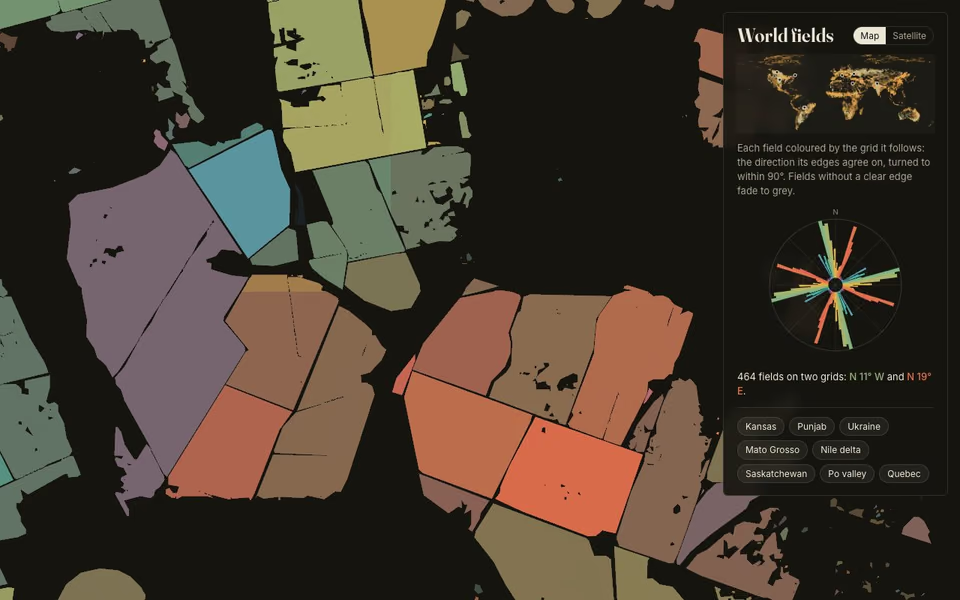
The Fields of The World 2nd Edition: about 140 million farm fields a year, traced from Sentinel-2 for every year from 2017 to 2025. Up close, each field is colored by the grid it follows, measured in the browser from its polygon, so survey systems show at a glance: Kansas sections, Quebec's long lots, the Roman centuriation north of Padua. A live rose sums the grain of everything in view, a timeline steps through the years, and an earlier year's outlines show where the cerrado was cleared.
2 Understory
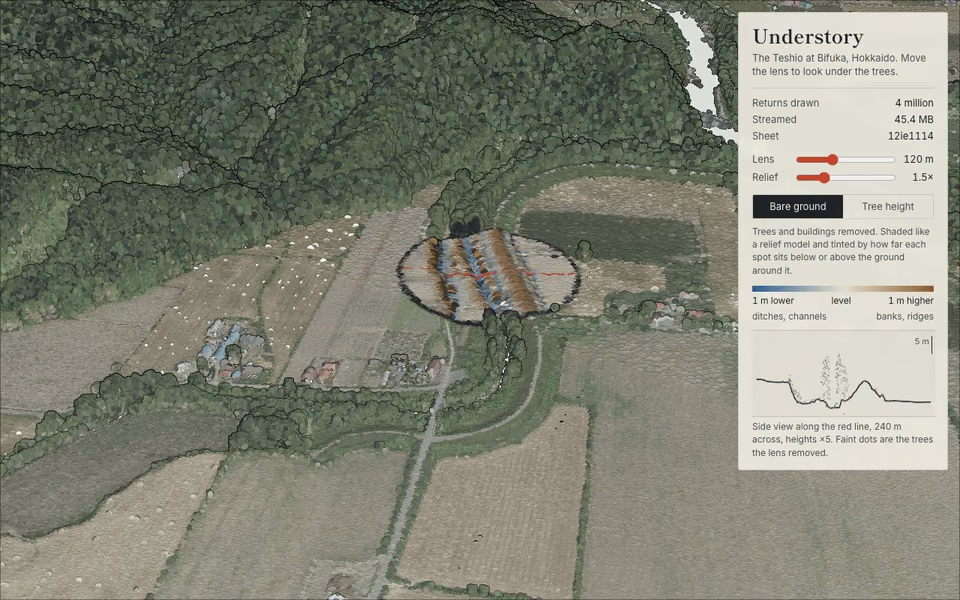
Hokkaido Prefecture's aerial lidar, streamed in the browser from 3,538 cloud-optimized point cloud files: the Teshio river at Bifuka in the survey's own color, shaded by eye-dome lighting like a model on a white table. Move the lens to look under the trees: bare ground, hillshaded and tinted where it dips or rises, or every tree colored by its height, with a side view of the slice through the lens.
3 Flow field
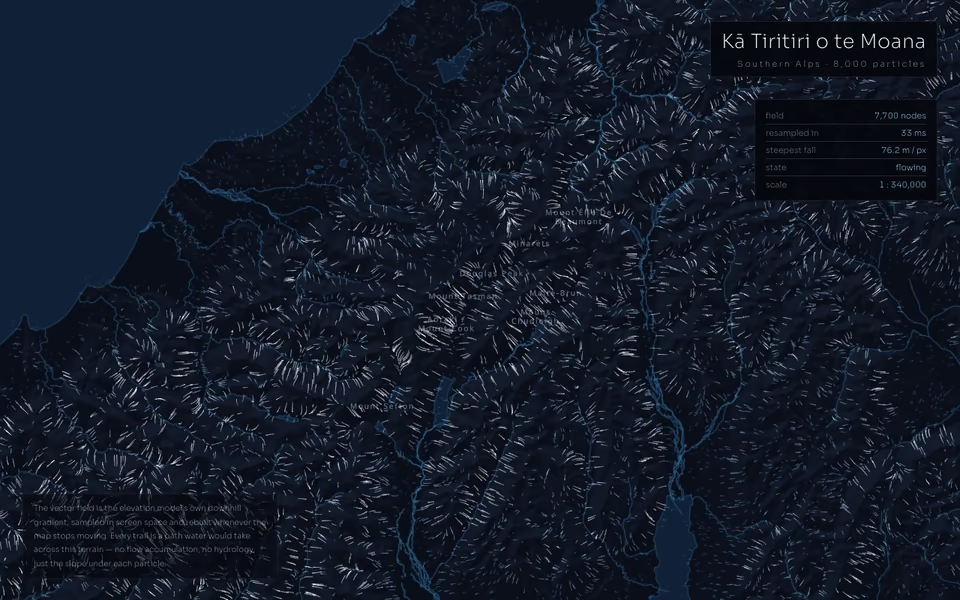
Eight thousand particles released onto the Southern Alps and left to run downhill. The vector field is the elevation model’s own gradient, so every streamline is a path water would actually take, and the braided rivers appear where the trails collect.
4 Relief bench
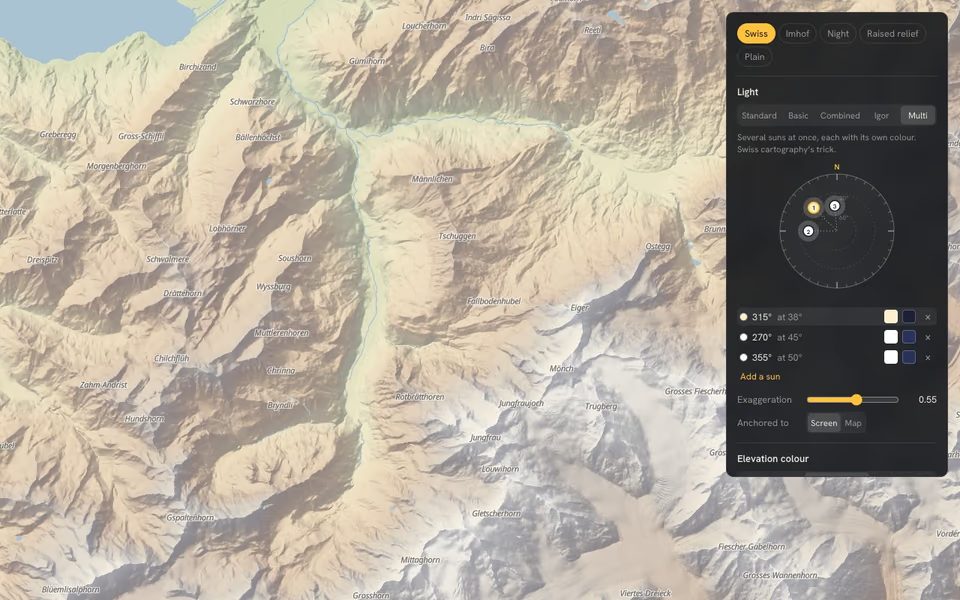
A workbench for shaded relief. Drag suns around a dial, switch between the five MapLibre hillshade methods, and layer elevation ramps, contours and 3D terrain to compare how each approach draws the same Alps.
5 Overwatch
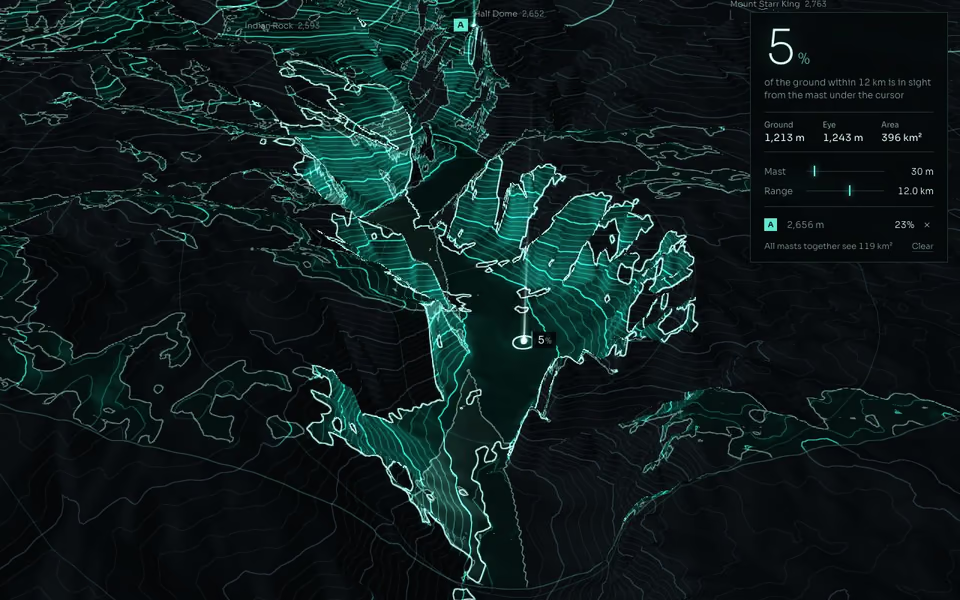
Yosemite Valley as a recon display. The GPU works out, from wherever the cursor rests, which ground is in sight: a line-of-sight test on every point of a million-cell terrain, redone each time the mast moves. Coverage floods over ridges and drains out of side canyons as you move. Click to pin up to four masts.
6 Canopy survey
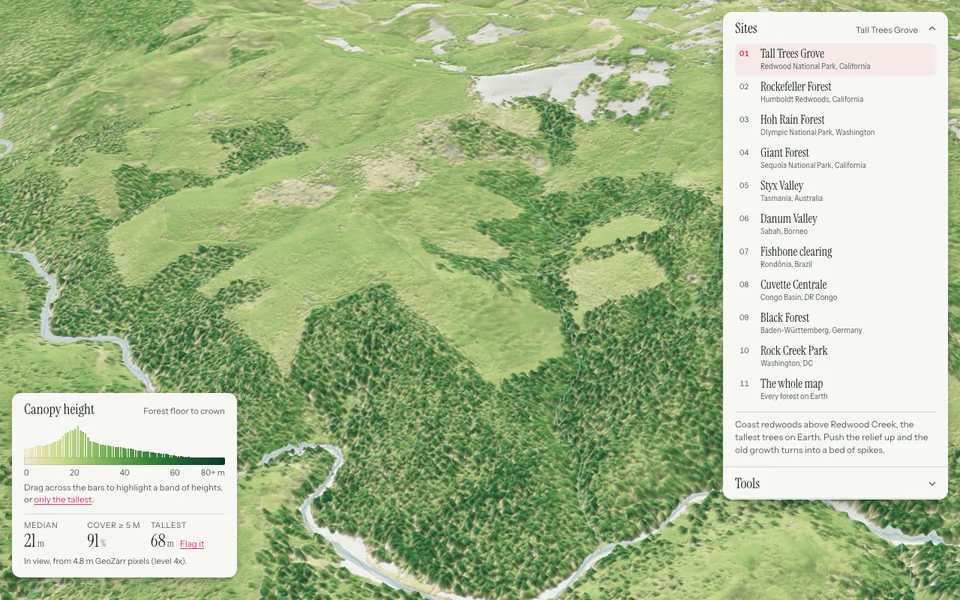
Twelve forests, tree by tree: Meta's 1.2 m global canopy height map decoded in the browser and raised in 3D on Mapterhorn ground. Flag the tallest tree in view, cut a transect, recolor by height and filter by when the imagery was taken.
7 Long exposure
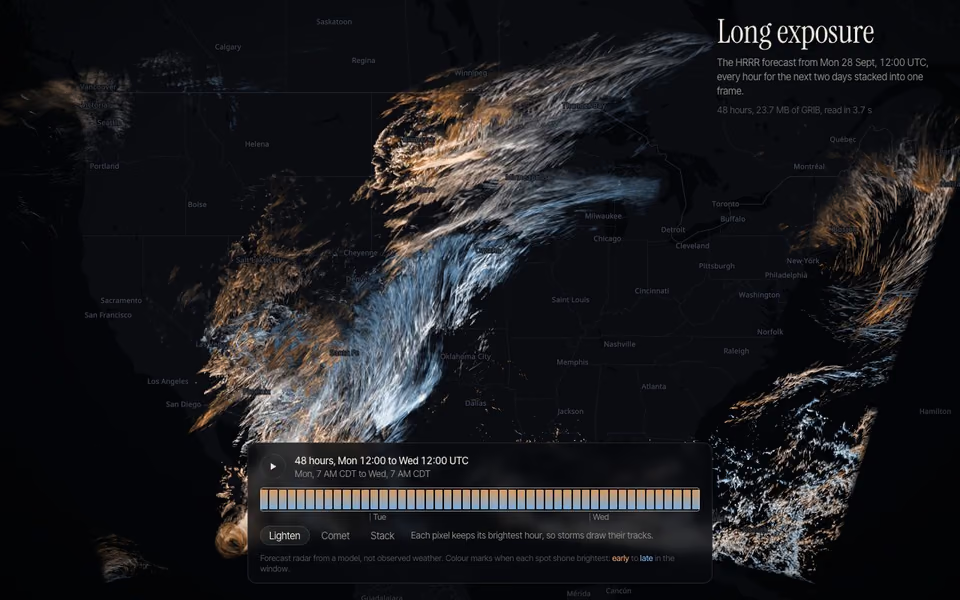
The next two days of storms over the United States, stacked into one long exposure: HRRR's forecast radar, hour by hour, draws storm tracks like star trails.
8 Obra Dinn
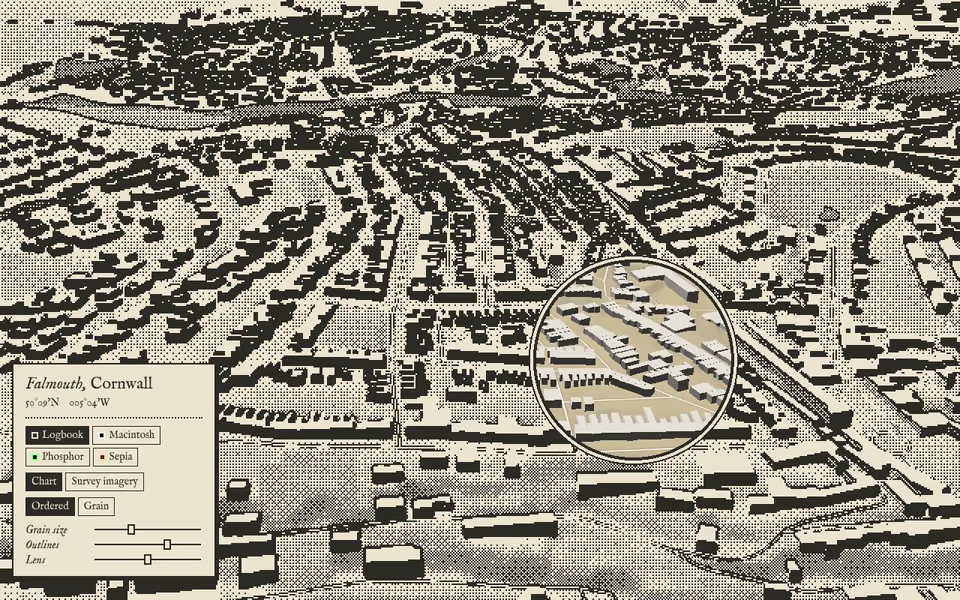
Falmouth, the port the Obra Dinn sailed from in 1802, in two inks. 3D terrain, lit buildings and a vector chart (or satellite imagery) run through a one-bit dithering pass that works on any MapLibre style. A ringed lens follows the cursor and shows the world in color.
9 Neon noir
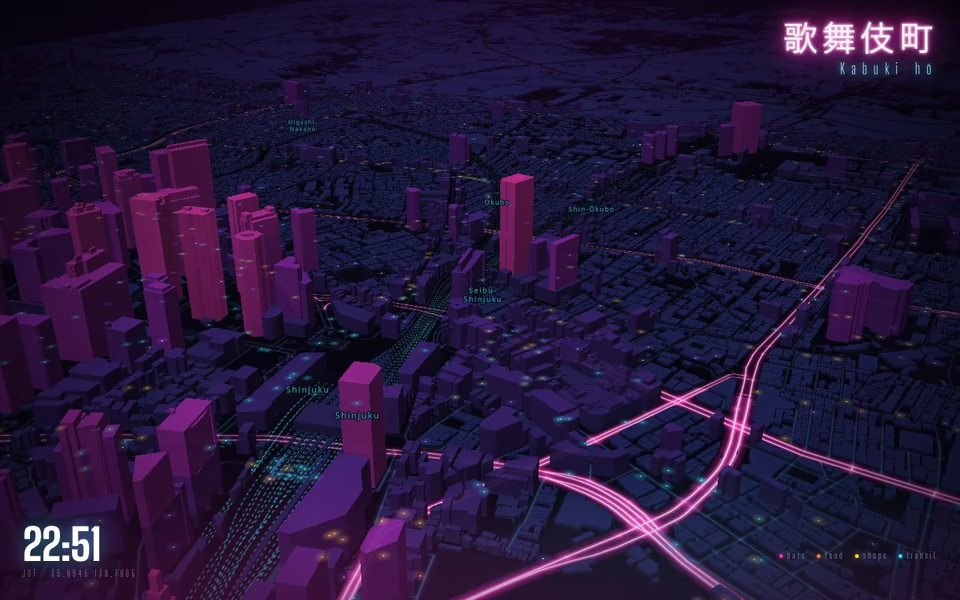
A city after midnight: buildings extruded into violet glass, streets as wet neon tubing, and every bar and konbini burning as a magenta pinprick. Shinjuku and Kabukichō, Tokyo.
10 Holo-topo
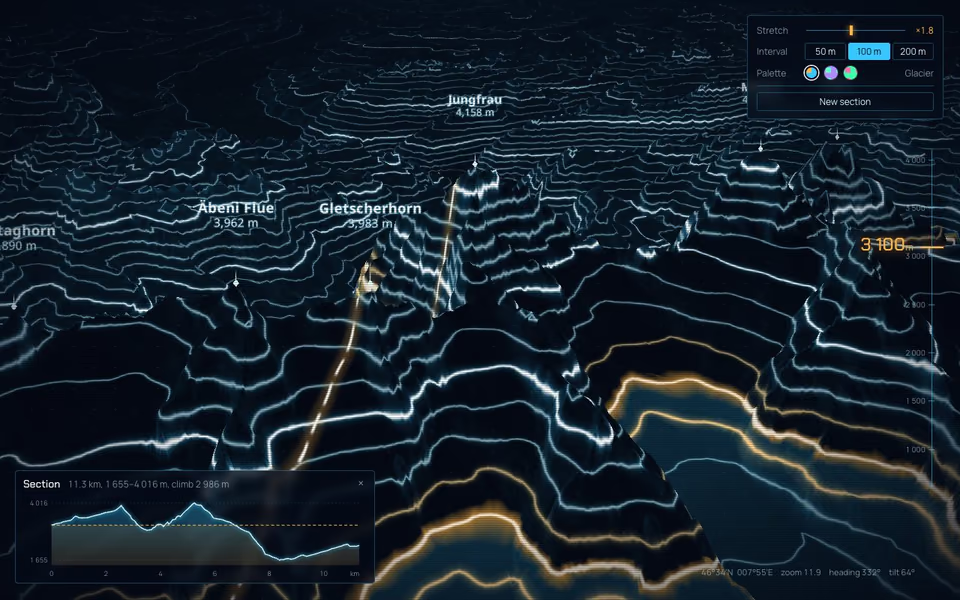
Contour lines from Mapterhorn elevation, drawn as a glowing holographic display over the Bernese Alps. A level plane sweeps up and down through the terrain, lighting every ring it passes. Drag its rail to pin it, cut a section to get a live profile, change interval and palette, stretch the relief, or click a summit to fly there.
11 Drivers of loss
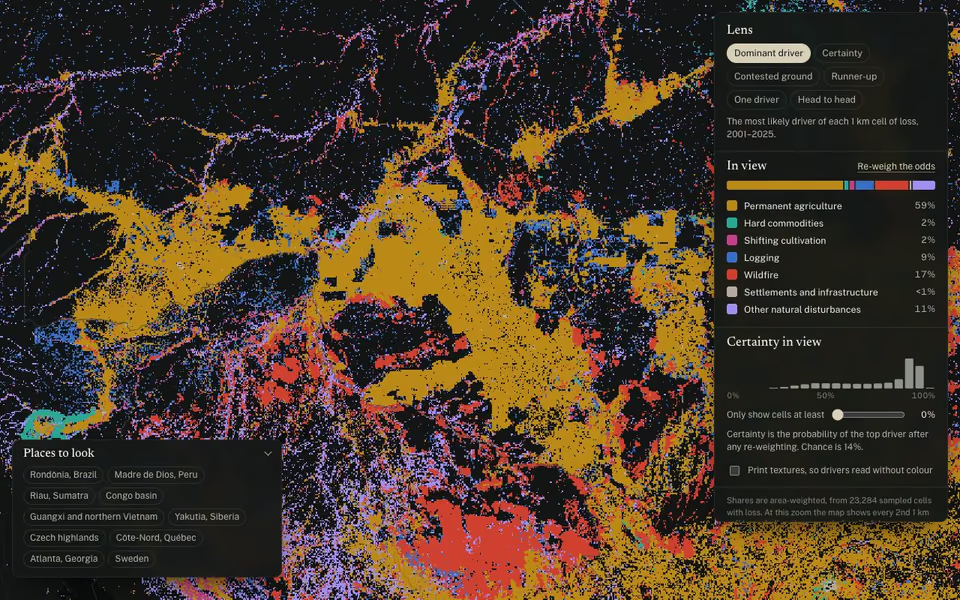
Why 25 years of tree-cover loss happened, cell by kilometer cell, read through the model’s own probabilities: its certainty, its runner-up, the ground it can’t decide, and what flips if you re-weigh the odds.
12 Fire almanac
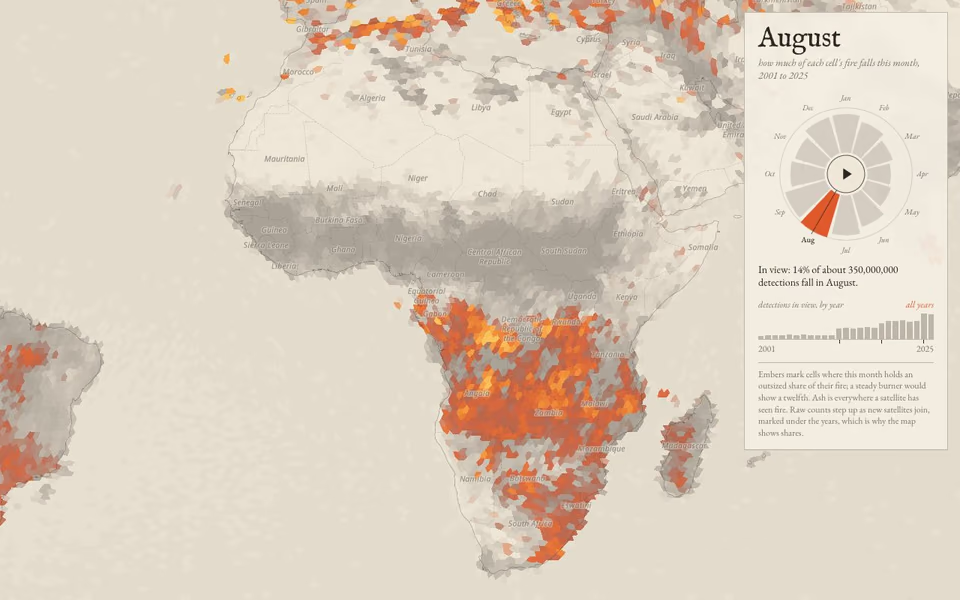
Twenty-five years of NASA's satellite fire detections as an almanac on bone paper. Turn the month dial and the embers move: Africa's savanna fires cross the equator with the dry season, south in August, north by January.
13 Fever chart
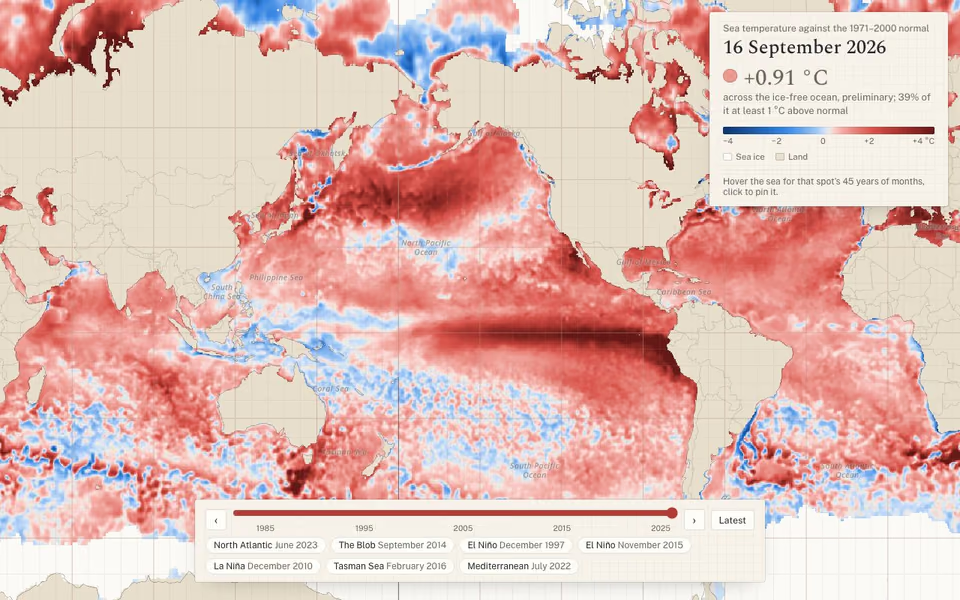
The ocean's temperature log: each day's sea surface temperature against the 1971–2000 normal, from 1981 to last week. Hover anywhere at sea and 45 years of that spot's months appear as warming stripes under the cursor.
14 Piri Reis
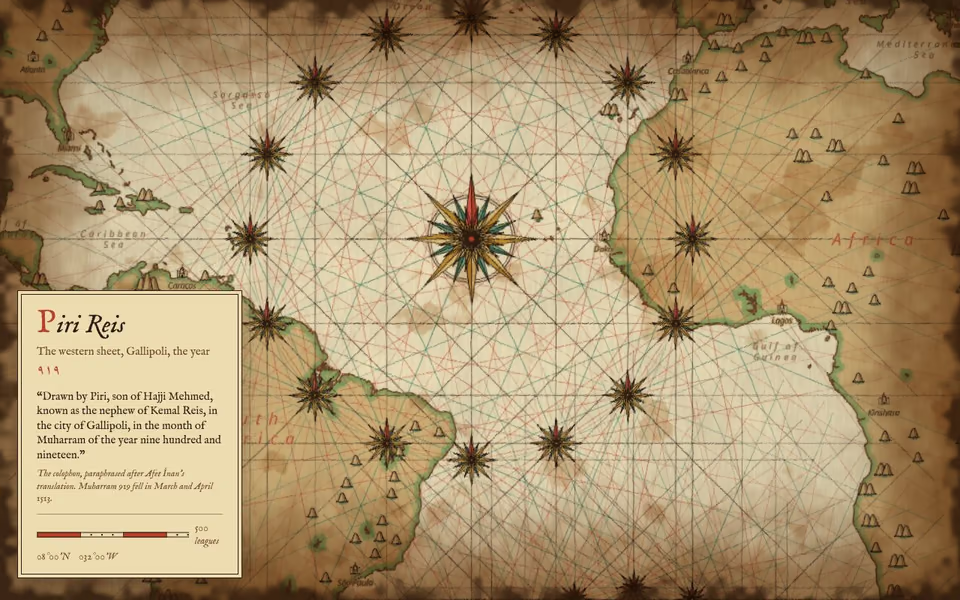
The Atlantic as Piri Reis drew it at Gallipoli in 1513: two portolan rose systems throwing black, green and red rhumbs across the ocean, washed coasts, pictorial mountains read from real elevation, on a parchment that travels with the map.
15 Sprawl rings
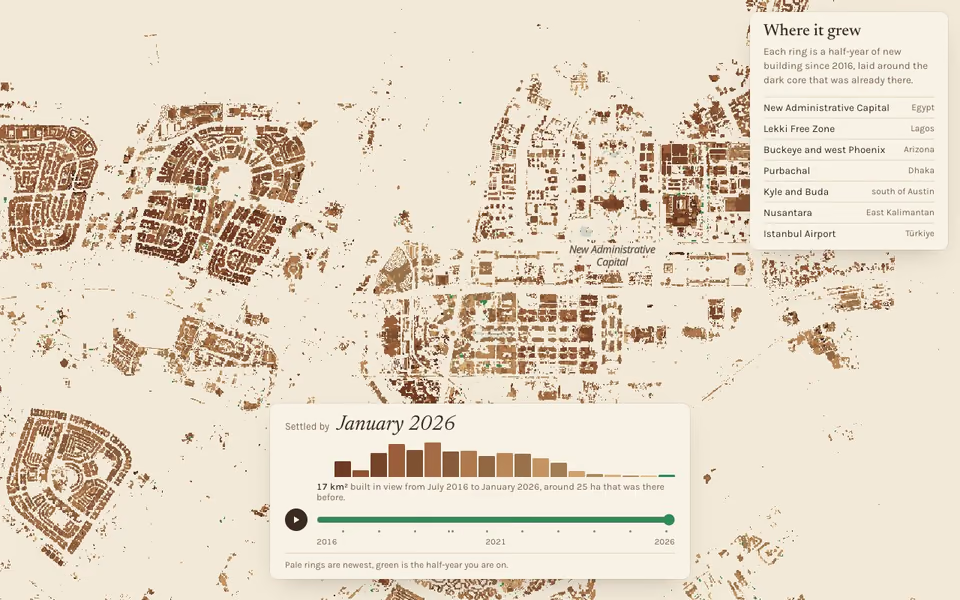
Cities read like a cut log: every half-year of new building since 2016 is a growth ring around a dark heartwood core, from the WSF Tracker's 10 m settlement dates. Scrub the decade and watch Egypt's new capital grow out of the desert.
16 Tomograph
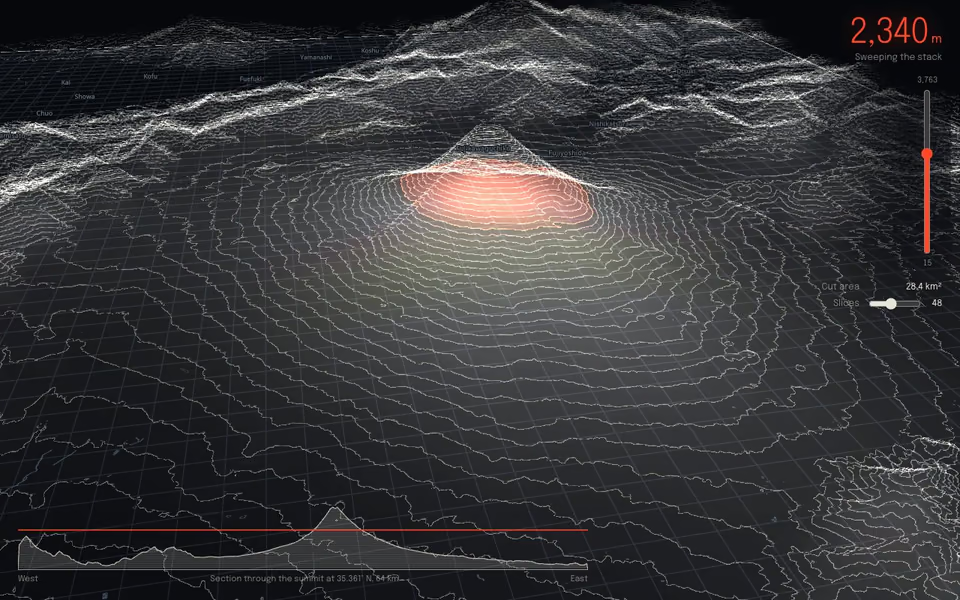
Mount Fuji scanned like a body in a CT gantry: the terrain cut into dozens of translucent elevation slices that float in 3D, with one vermilion slice sweeping up through the stack. Scrub it by hand to read any cross-section.
17 Ground station
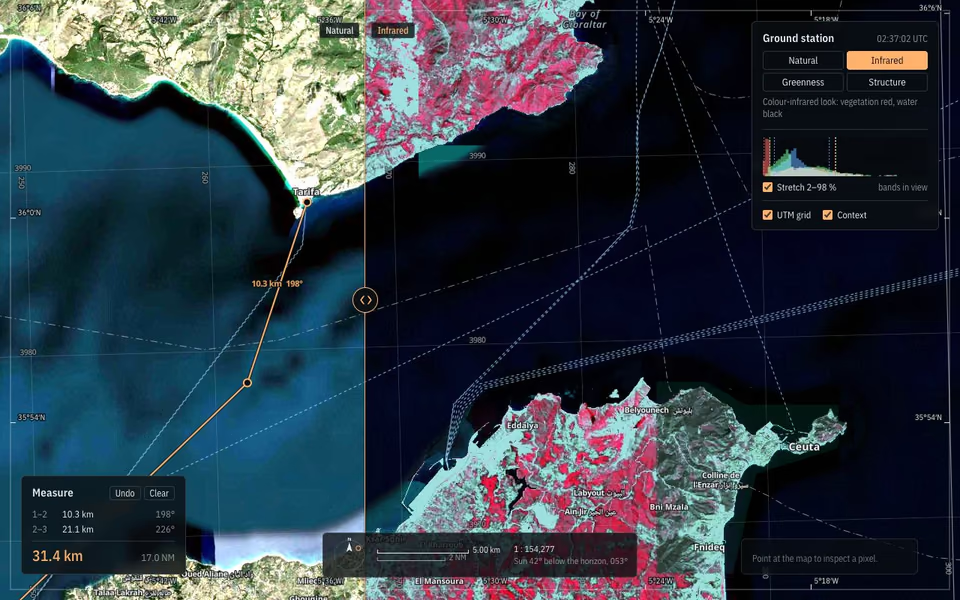
The Strait of Gibraltar on an imagery analyst’s desk. Satellite tiles are regraded live on the GPU into natural, infrared-style, greenness and edge views, with a swipe to compare. The contrast stretch comes from a histogram read back from the frame. Around them: a UTM kilometer grid, a coordinate collar, a pixel and elevation inspector, and a route measure in km and nautical miles.
18 Four-color process
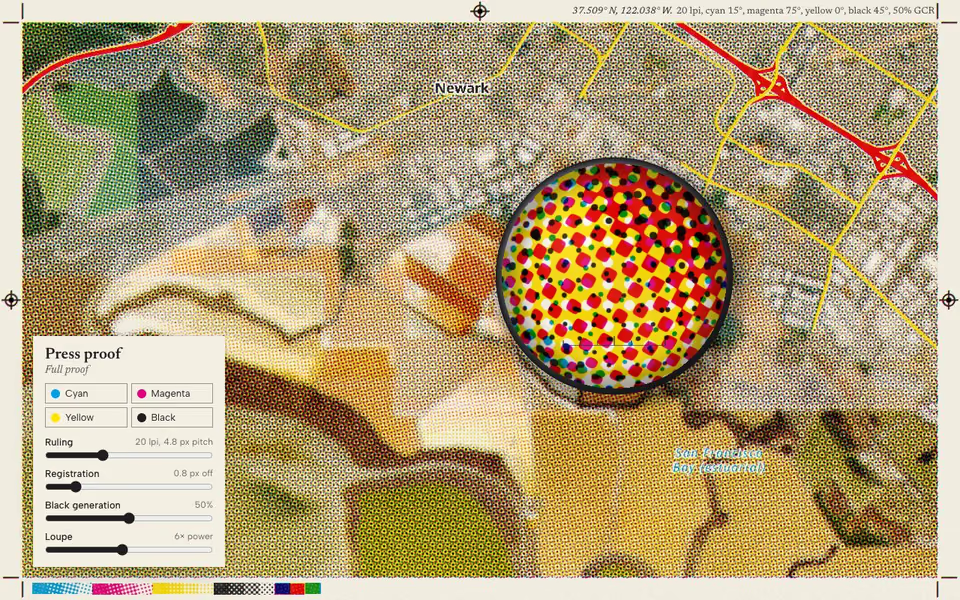
The salt ponds south of Newark, California, printed by offset litho. Every frame is separated into cyan, magenta, yellow and black plates and screened at the classic angles, while roads and type print solid. A loupe follows the cursor and shows the rosettes dot by dot.
19 Ink-wash relief
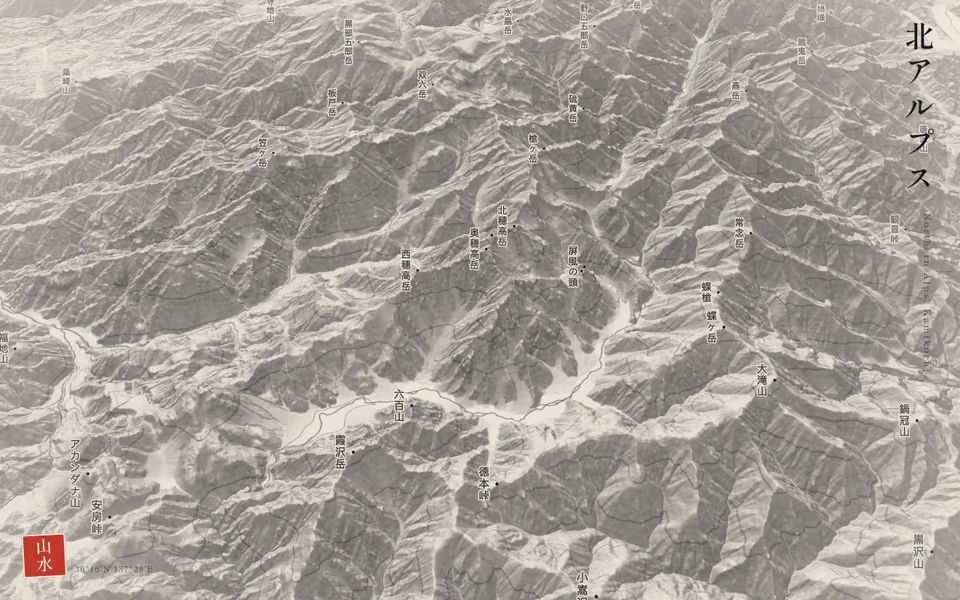
Mapterhorn terrain as a sumi-e brush painting: ink shadows on washi paper, thin contour strokes, vertical peak names, one vermilion seal. Northern Japanese Alps in 3D.
20 Wallace's realms
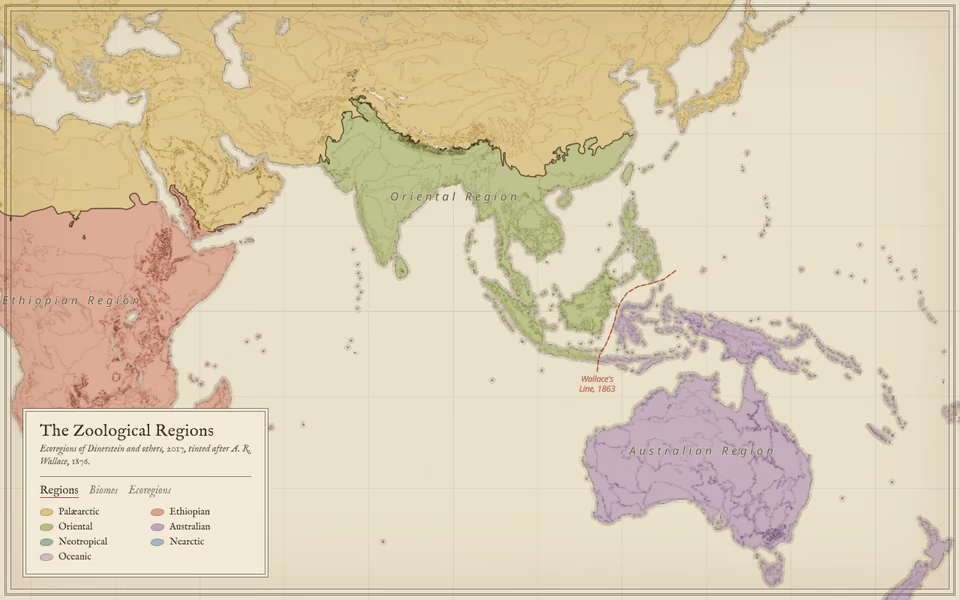
The world's 847 ecoregions washed in watercolor like Wallace's 1876 plate of zoological regions, with his line through the Lombok Strait. Hover a region for its specimen label.
21 First light
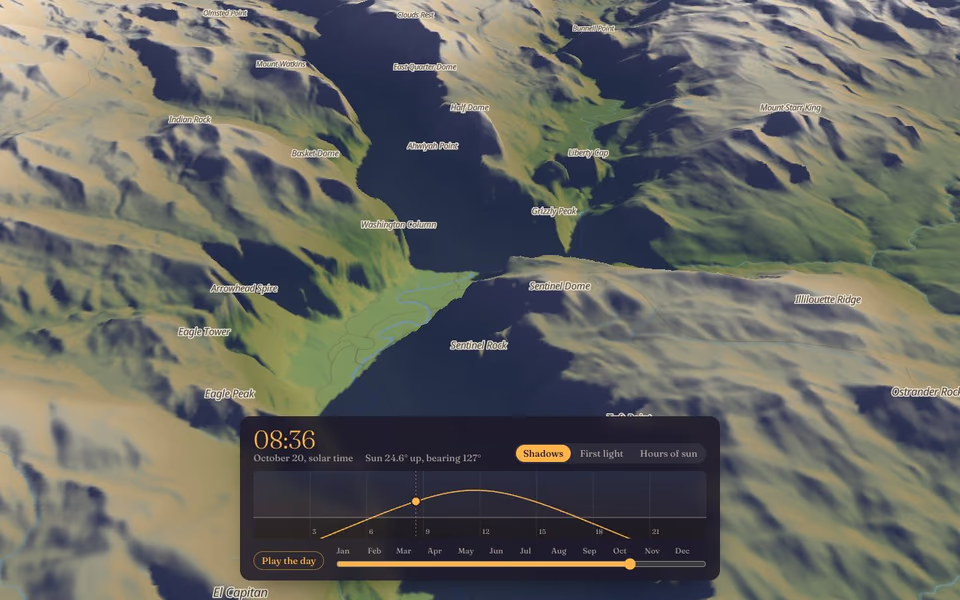
Yosemite Valley lit by the real sun for any day and minute: shadows cast by ray-marching the terrain, not faked with a hillshade. Scrub the day to watch them sweep the granite, or switch to a map of when the sun first reaches every spot.
22 Watershed
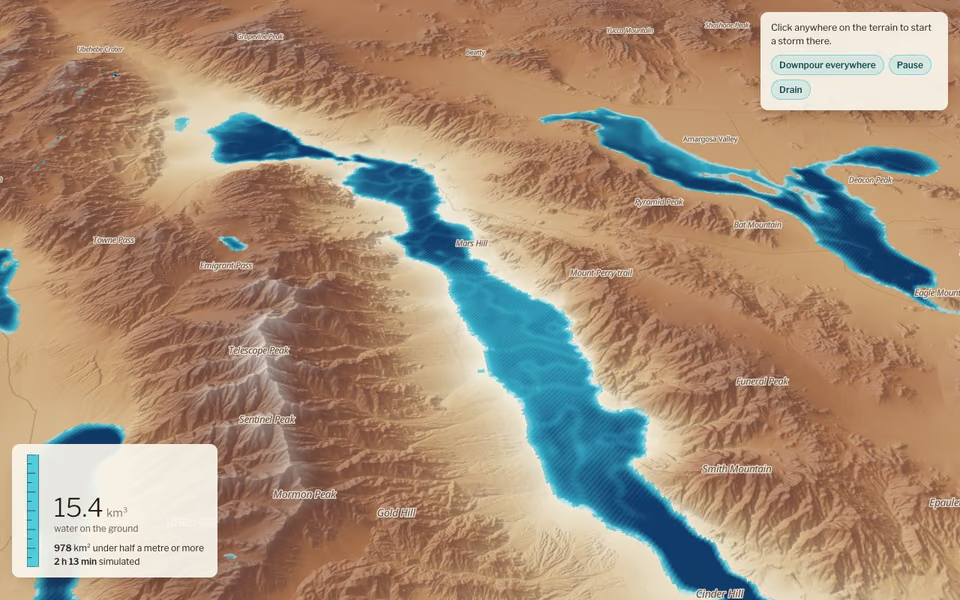
Rain on real terrain, simulated on the GPU. Click the mountains around Death Valley to start a storm and watch the water run off the ranges, braid into rivers and pool on the salt flats into a lake that has not stood there for ten thousand years.
23 Clean-room
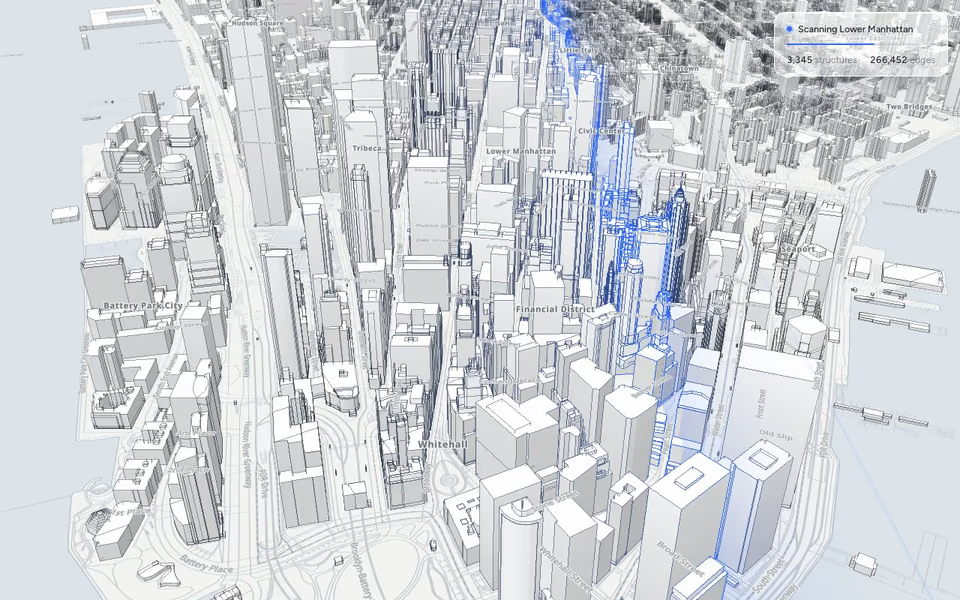
Science fiction in daylight: Lower Manhattan as frosted white volumes traced in graphite hairlines, on a pale sheet. A blue scan front sweeps the island every few seconds, and every edge it crosses flashes.
24 Blueprint
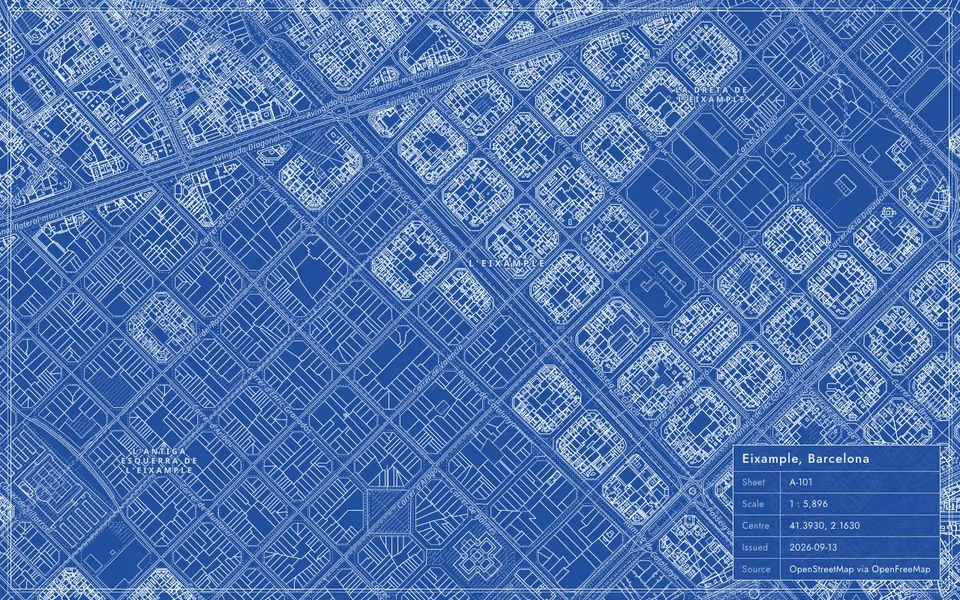
Streets and buildings drawn as an architect's sheet: white line work and hatching on cyanotype blue, with a live title block. Barcelona's Eixample.
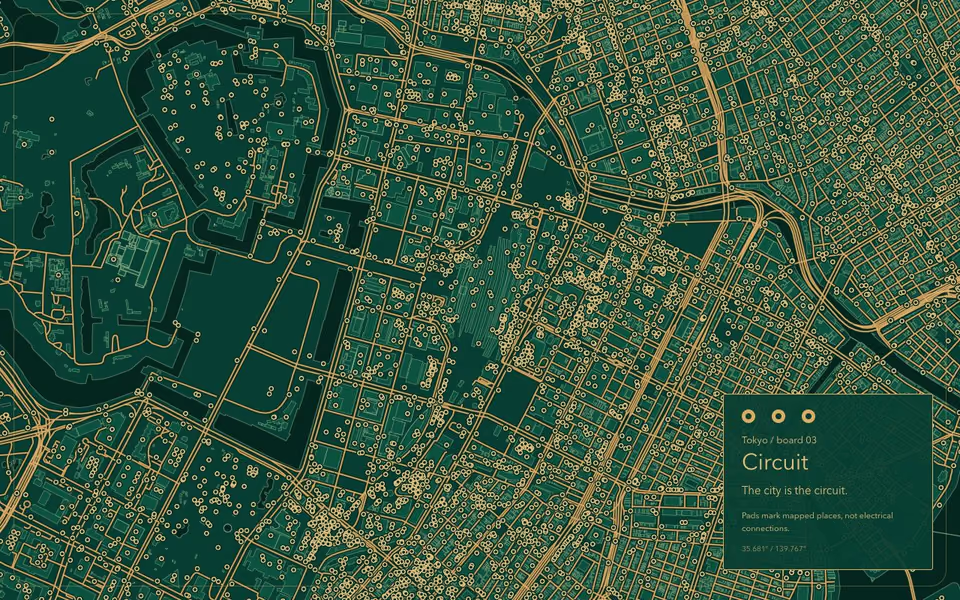
25 Circuit
Tokyo becomes a printed circuit board: copper street traces, plated POI pads, and building footprints etched into green solder mask.
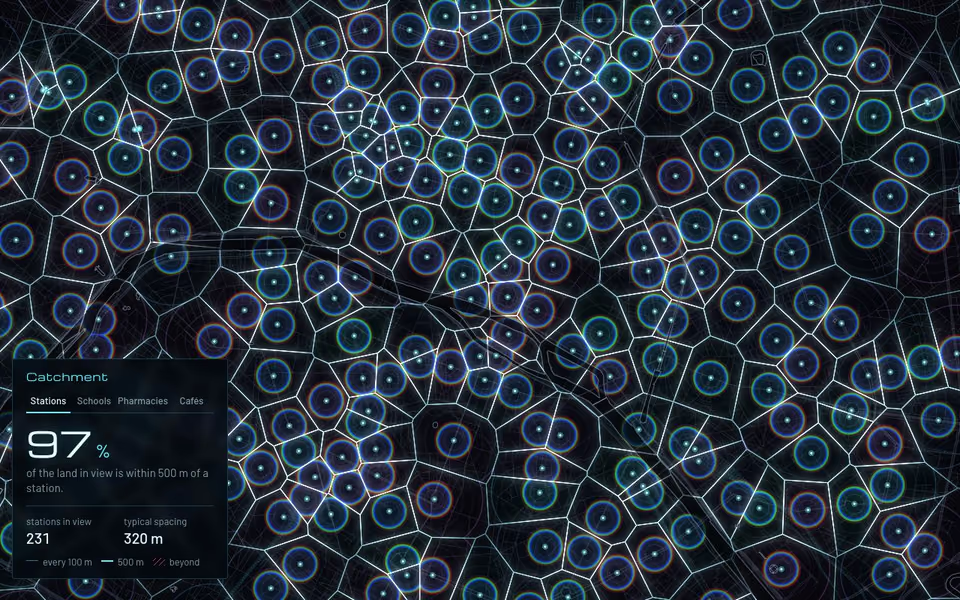
26 Catchment
Paris cut into the territory of each métro and RER station: a Voronoi diagram and distance field computed on the GPU by jump flooding, rebuilt every frame from the map’s own framebuffer. Every station pulses outward in sync, so neighboring pulses meet on the borders between them.
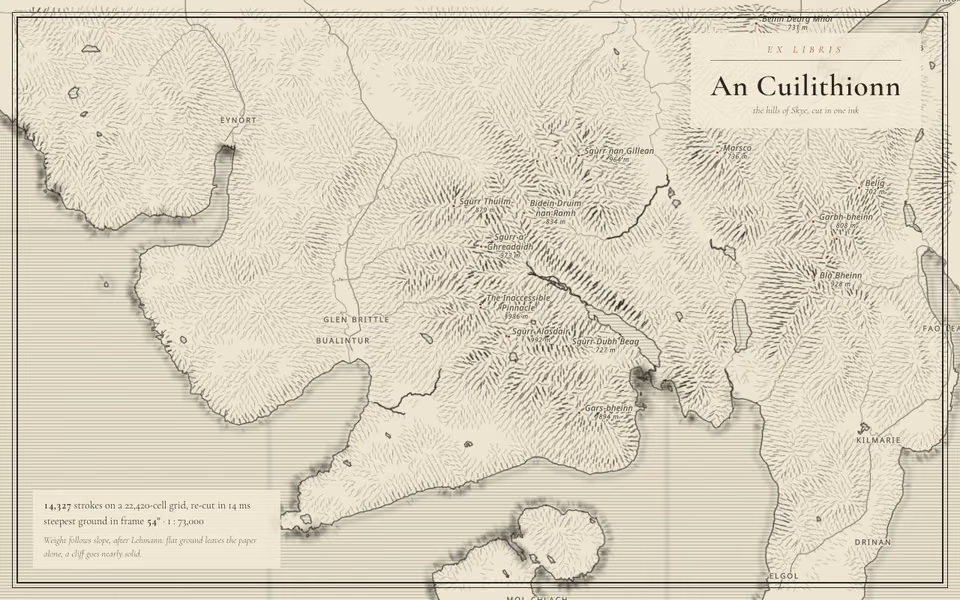
27 Ex libris
The Cuillin of Skye engraved as a bookplate: no contours and no shading, only Lehmann hachures cut straight down the slope and weighted by how steep the ground is, with the sea ruled in lines around the coast. One ink on cream.
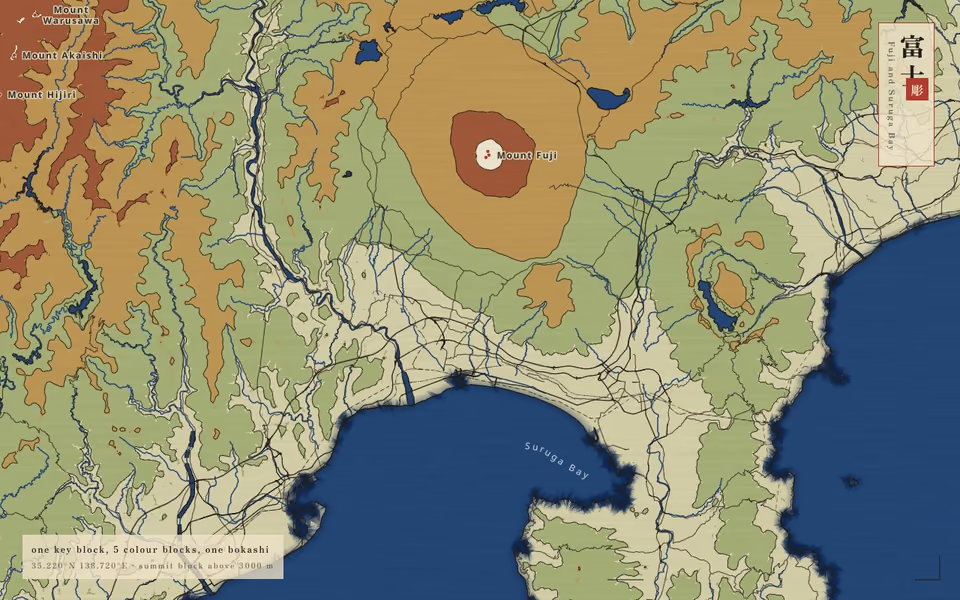
28 Woodblock
Fuji and Suruga Bay cut into blocks: flat color areas with hard edges, a black key block carrying the line work, a graded indigo bokashi along every shore, and the grain of the plank printing through.
29 Isochrone bloom
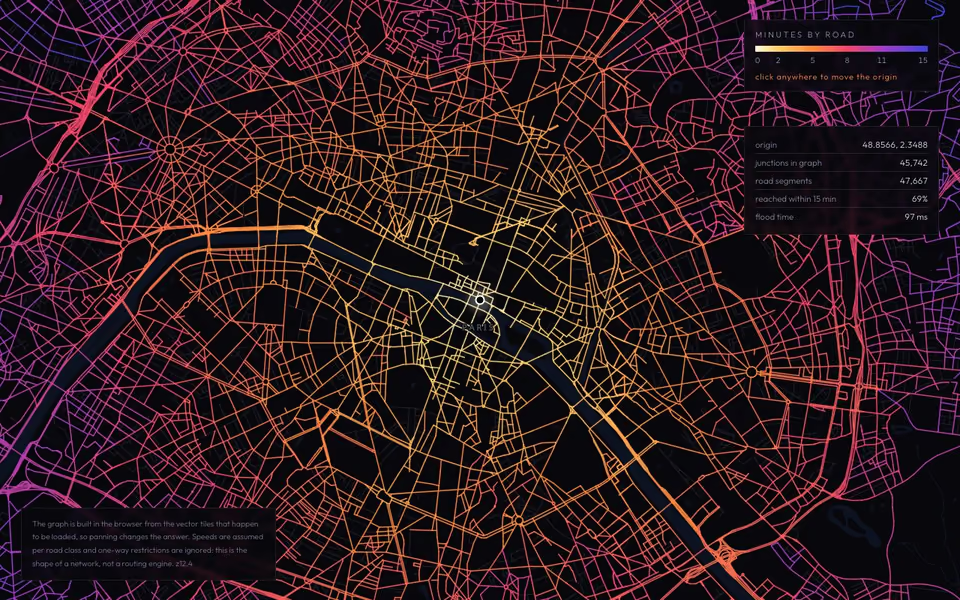
One point in Paris, and fifteen minutes of driving flooded out from it along the road network. The graph is built from the vector tiles in the browser; click anywhere to move the origin and watch the bloom take the shape of the streets.
30 Thermal scan
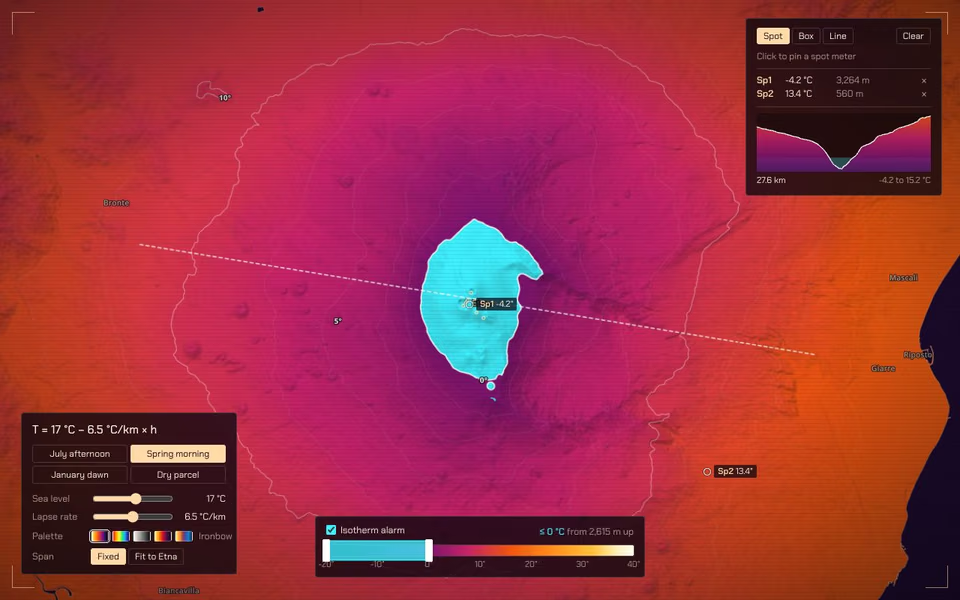
Mount Etna through a false-color thermal camera. Elevation runs through a lapse rate you can set, so contours become isotherms and the summit is the cold spot. Drag the isotherm alarm along the scale and watch the freezing line climb the volcano; pin spot meters, box an area or draw a temperature profile.
31 Paper Relief
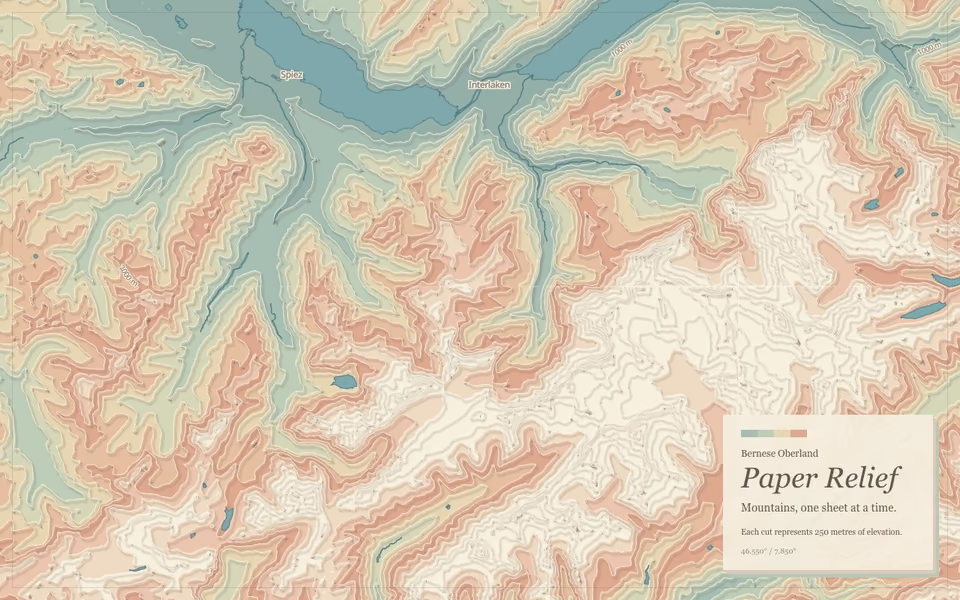
Alpine elevation sliced into mint, peach, and cream sheets. Offset contour shadows turn a flat terrain map into a cut-paper model.
32 Nolli
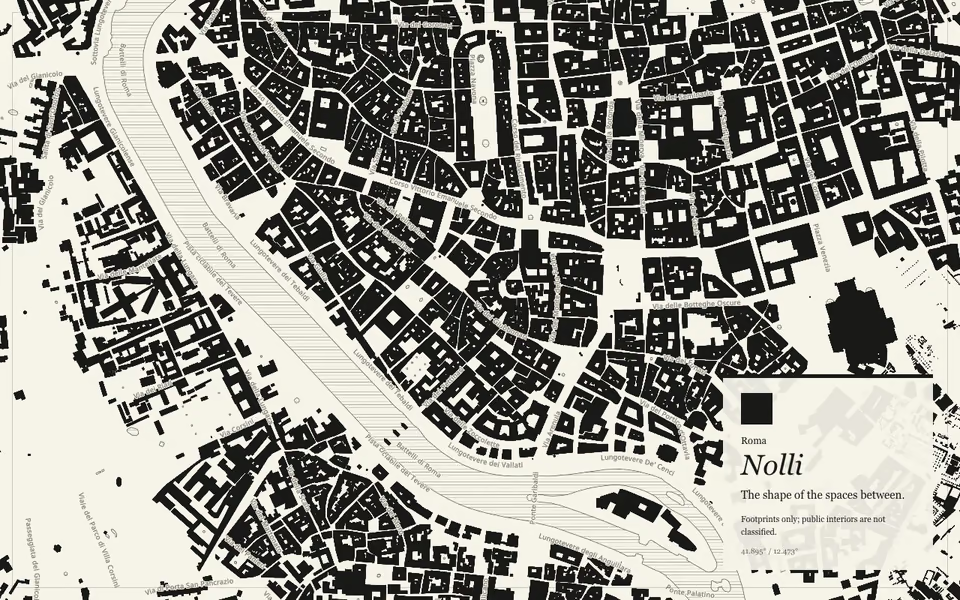
The city reduced to solid and void: black building footprints, white streets, and a finely ruled river. A contemporary figure–ground study of Rome.
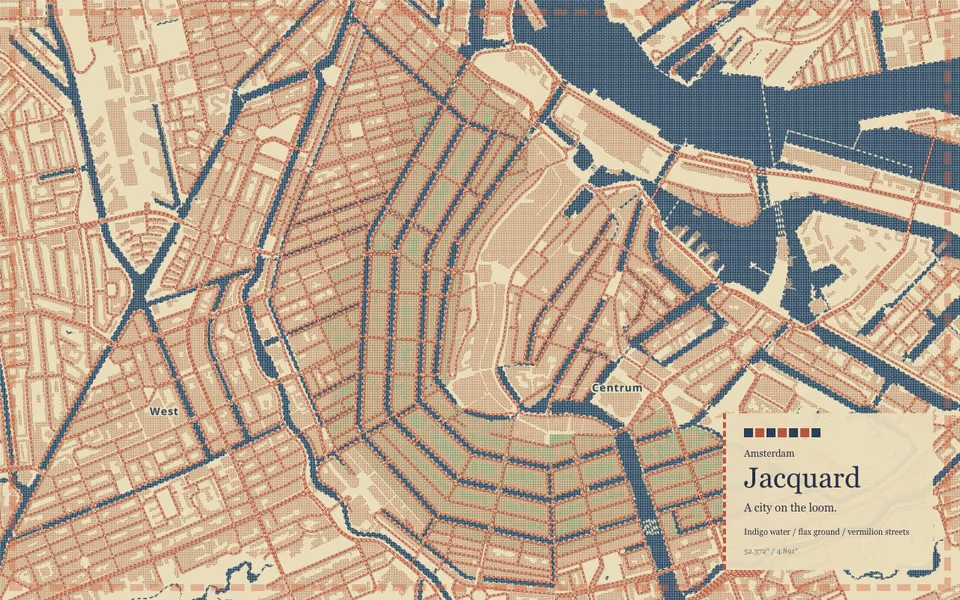
33 Jacquard
Amsterdam woven from indigo warp, cream weft, and vermilion running stitches. Land and water use opposing thread structures.
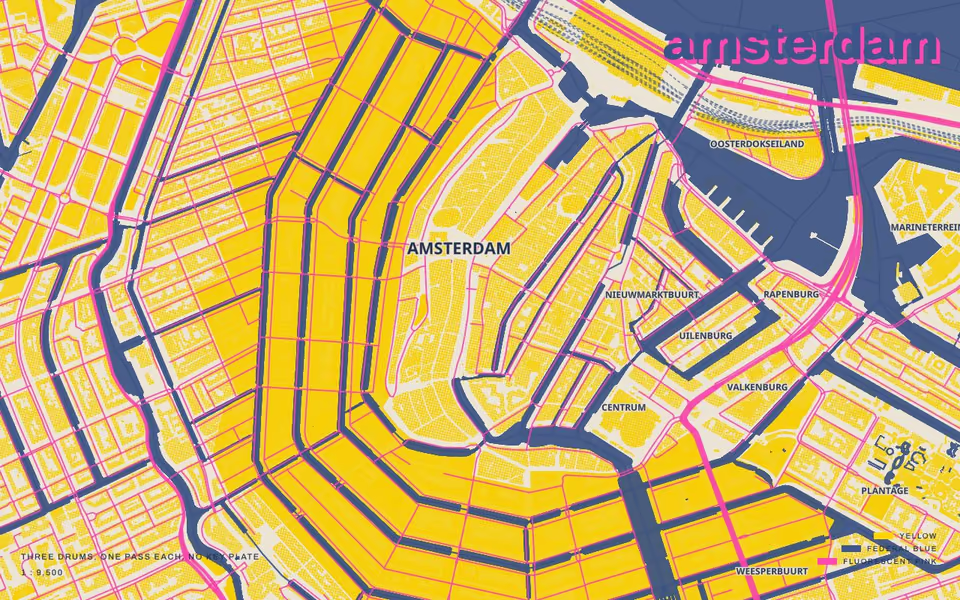
34 Risograph
Amsterdam printed on a duplicator in three passes of spot ink — fluorescent pink, federal blue, yellow — on newsprint. Each pass lands a few pixels off, and where two inks overlap they make a color neither of them has.
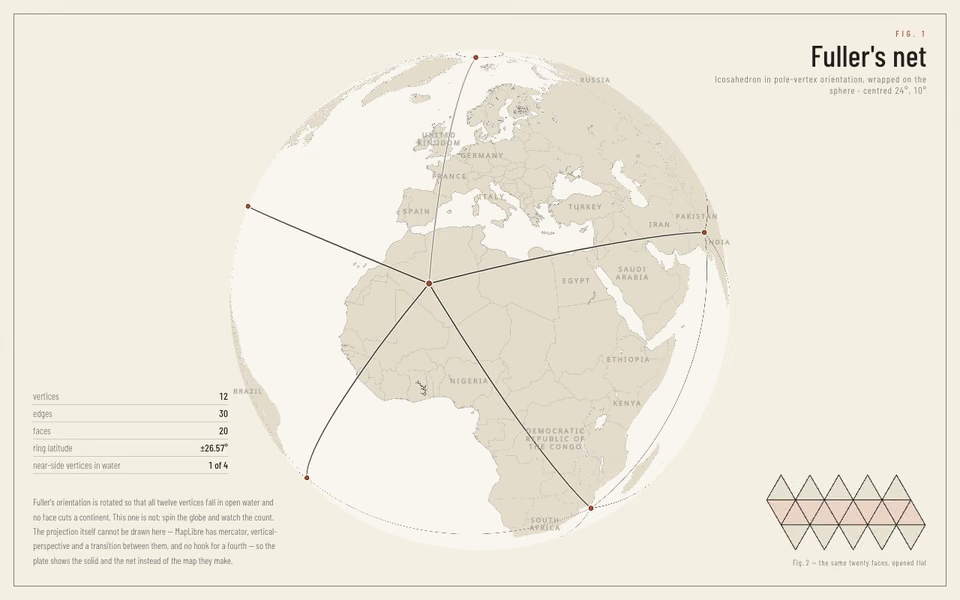
35 Fuller's net
The solid a Dymaxion map is cut from, drawn as a patent plate: twelve vertices and thirty great-circle edges wrapped on the globe, with the twenty faces laid flat beside it. MapLibre has three projections and no way to add a fourth, so this is the icosahedron rather than the map it unfolds into.
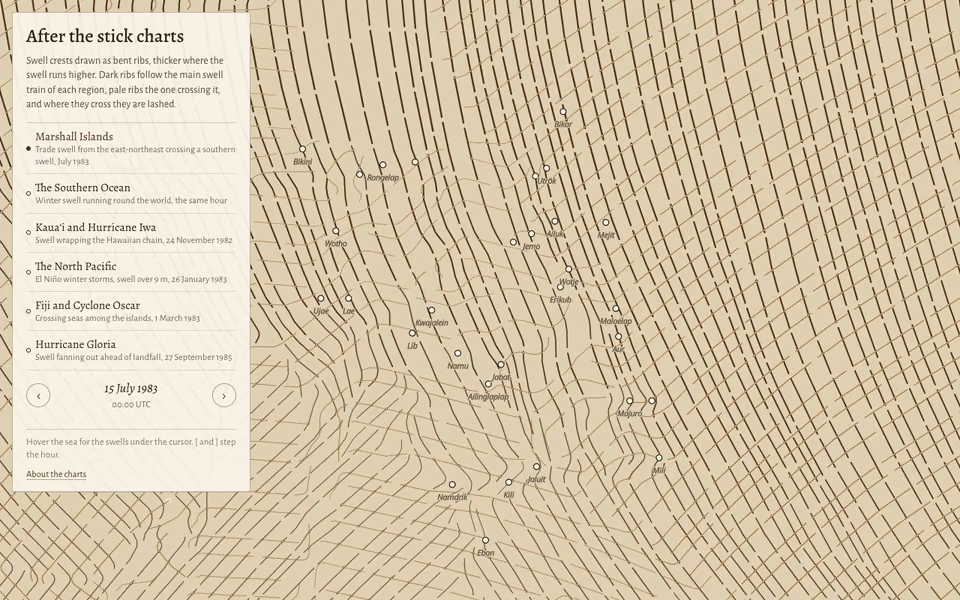
36 After the stick charts
Swell crests from the Copernicus wave reanalysis drawn as bent, lashed ribs, in homage to the Marshallese stick charts: dark sticks for the primary swell, pale ones for the secondary, so crossing seas read as a lattice.
37 Seismic
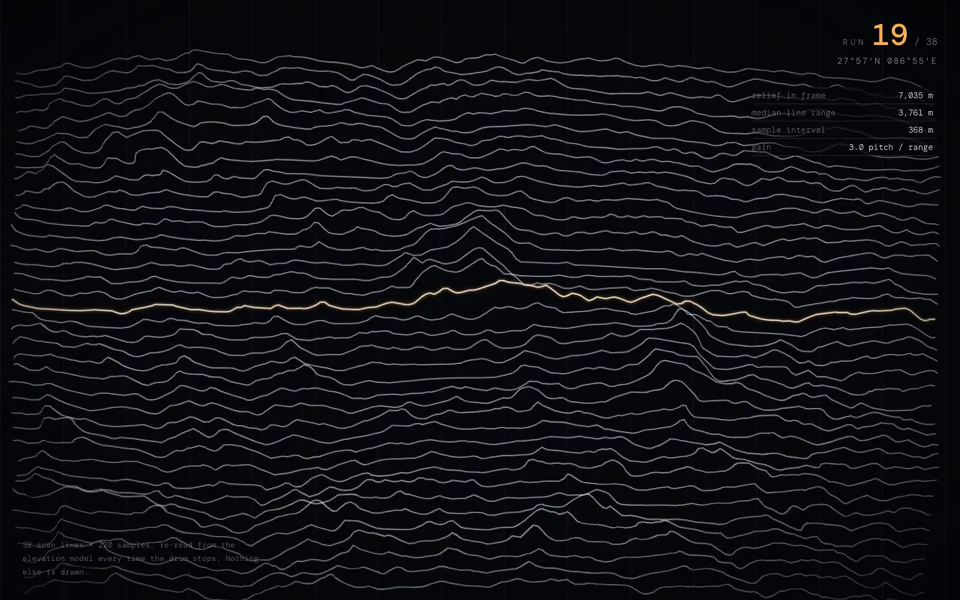
The Khumbu read off a drum recorder. Fifty-two scan lines are run across the frame, the terrain is sampled along each one, and the elevation comes out as a deflection — no contours, no shading, no labels, just the traces and a stylus walking down them.
38 Relief synth
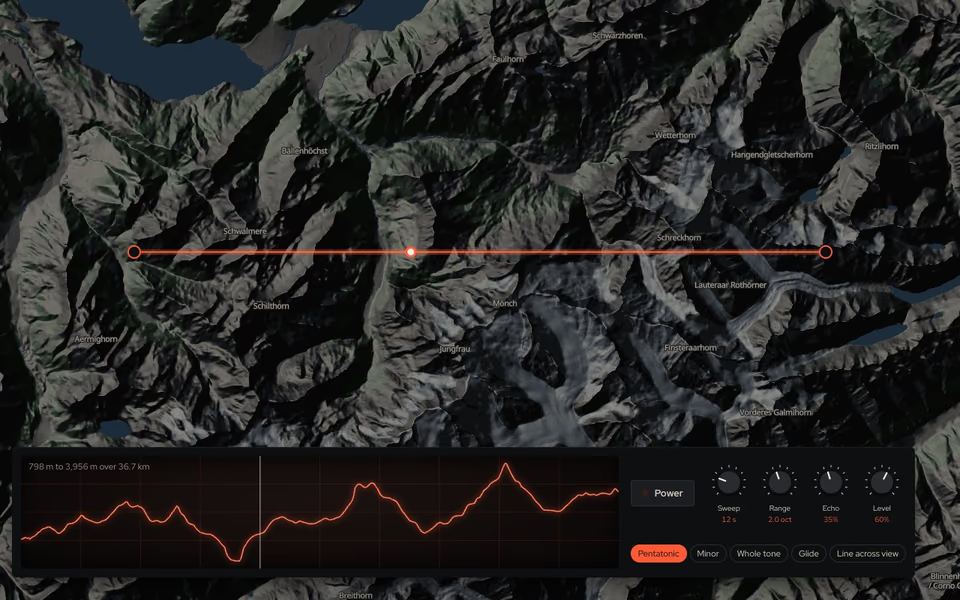
Terrain you can hear. Drag a scan line across the Alps and a synthesizer plays the ground beneath it: elevation becomes pitch, steepness opens the filter, forest and water breathe as noise. The oscilloscope trace is the mountain profile itself.
39 Soil survey
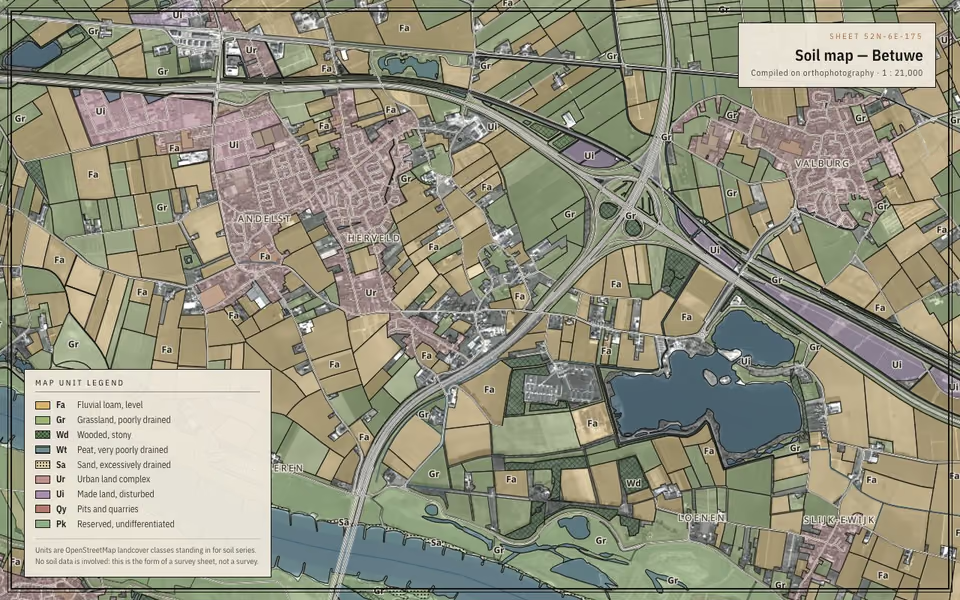
A county soil survey sheet: orthophoto base, flat overprinted map units with hard boundaries, and a two-letter symbol dropped in every polygon. The units are OpenStreetMap landcover standing in for soil series — the form of the document, on the data we have. Betuwe, Netherlands.
40 Sweep
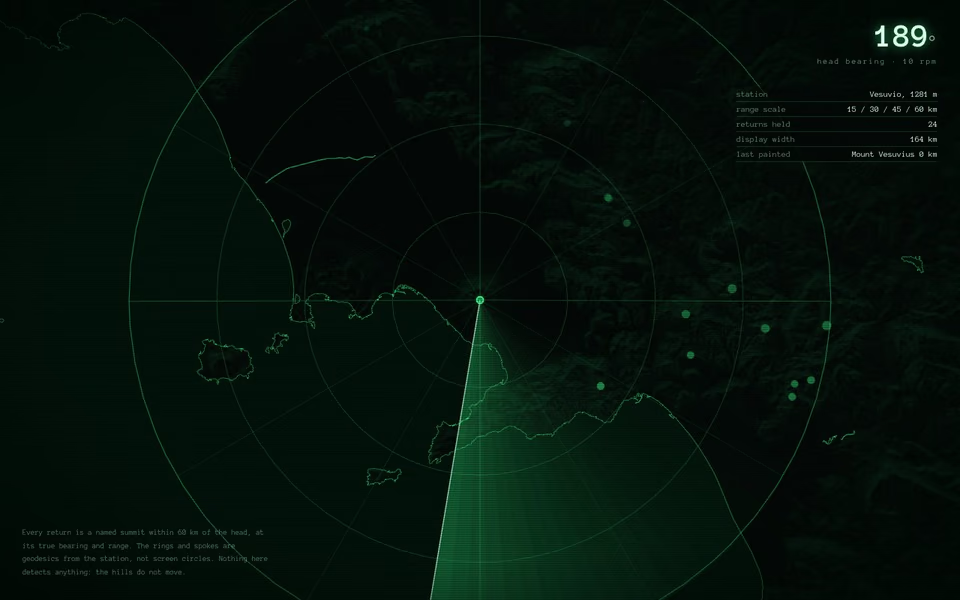
A plan position indicator on the summit of Vesuvius. Range rings and bearing spokes are real geodesics from the station, the returns are the actual summits within sixty kilometers, and the beam lights each one as it passes and lets it decay.
41 Tide chart
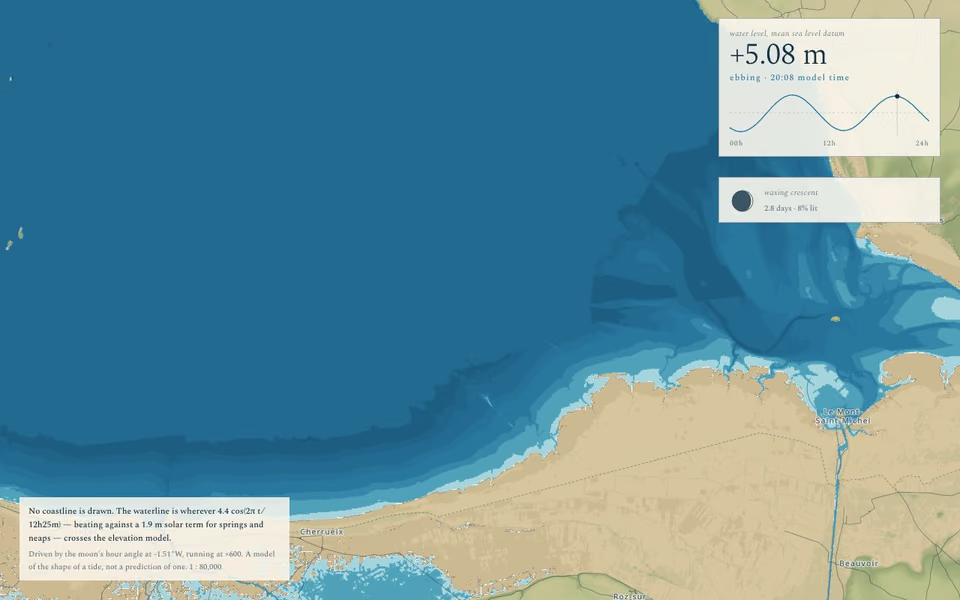
The bay of Mont-Saint-Michel with no coastline drawn: the waterline is wherever the modeled tide meets the elevation model, and it moves. Driven by the moon's hour angle and phase, running at six hundred times real time.
42 Typefield
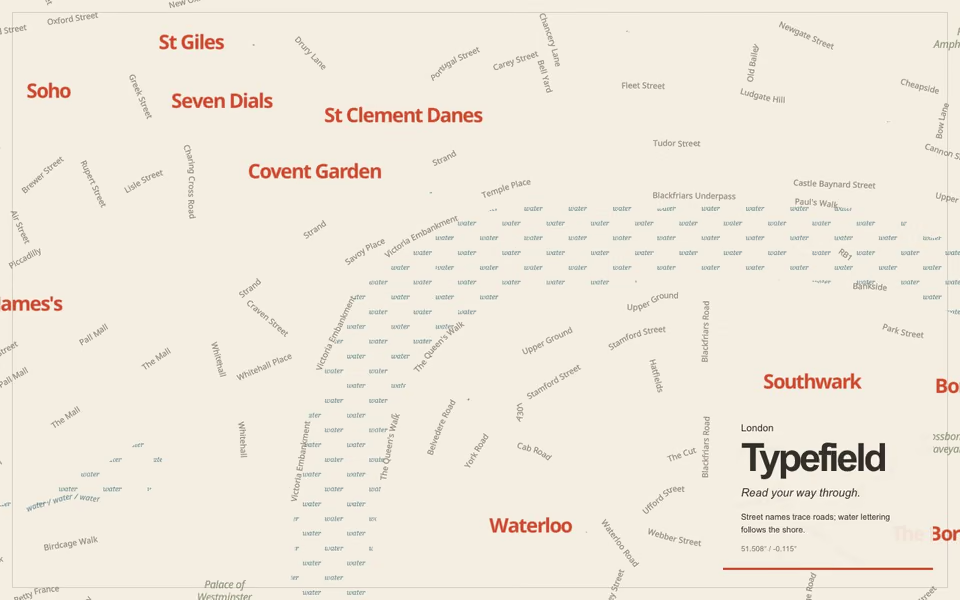
London drawn with language: road names become streets, repeated water lettering forms the Thames, and districts float in the negative space.
43 Hypsometric atlas
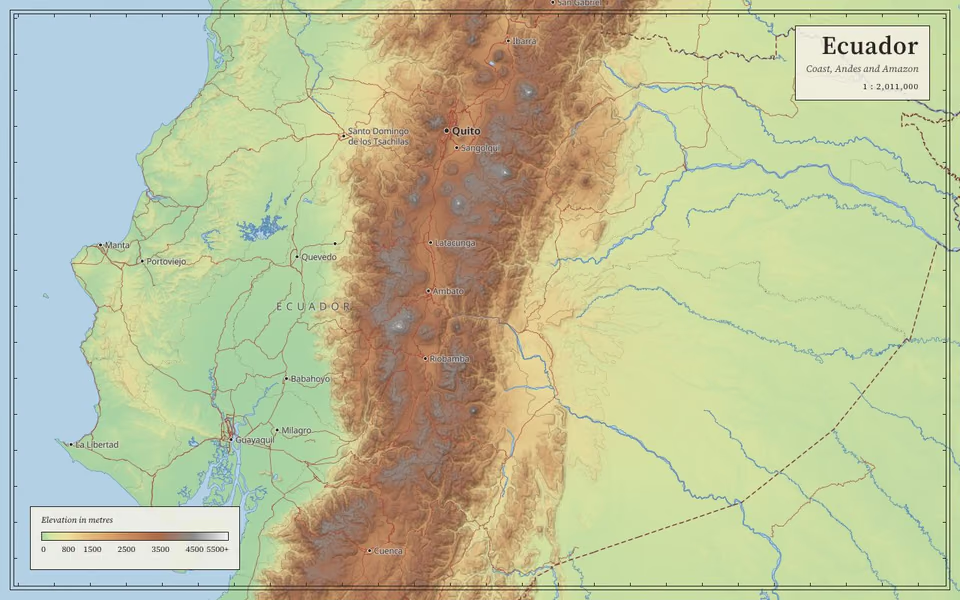
A school-atlas plate: elevation tints from Mapterhorn through MapLibre's color-relief layer, faint contours, dashed borders and serif labels. Ecuador, from the coast over the Andes to the Amazon.
44 Event horizon
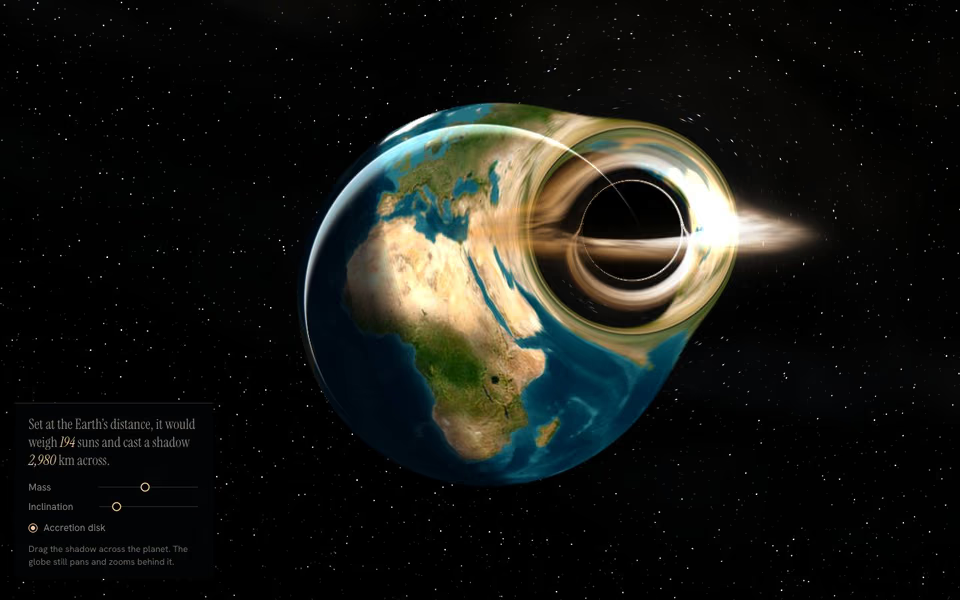
A black hole drifting in front of a live globe, lensing it in real time. A post-process bends every pixel by a Schwarzschild deflection, and a ray-traced accretion disk, bright and blue on the side turning toward you, arcs over its own shadow. Drag the hole across the Earth; the map keeps working underneath.
45 Lidar
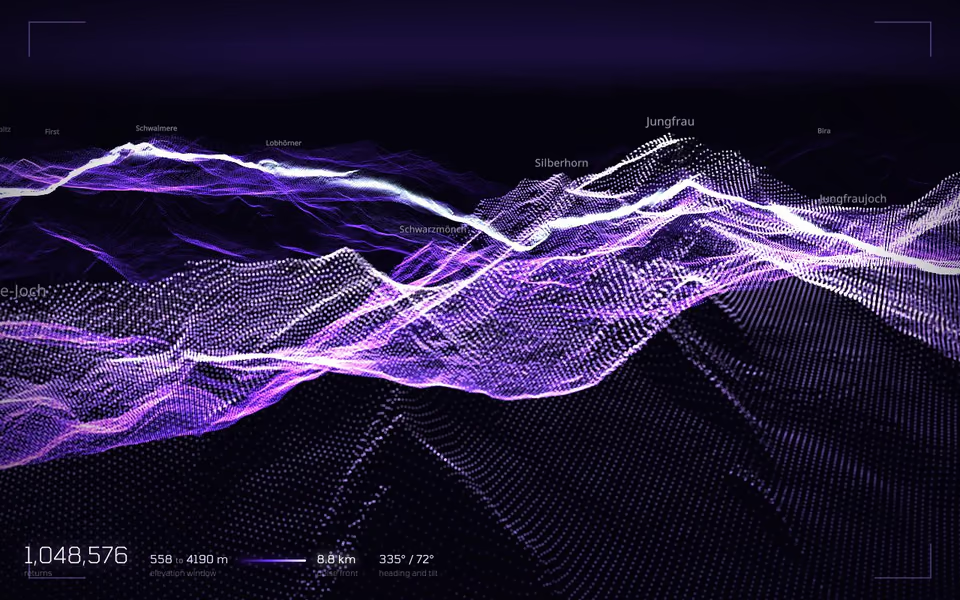
The Jungfrau massif as a million glowing lidar returns, drawn by a custom WebGL layer from raw Mapterhorn elevation. Click anywhere to fire a scan pulse and watch the ring race through the cloud.
46 Mission control
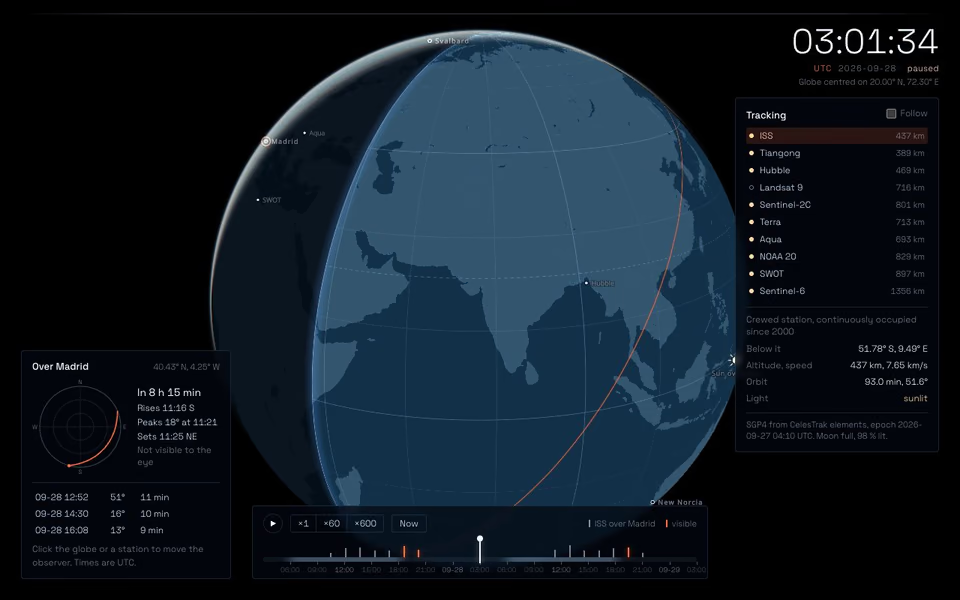
A console globe tracking ten real satellites from CelesTrak elements with SGP4: the ISS, Tiangong, Hubble and a set of Earth-observation missions. Each track dims where it runs through the Earth’s shadow, under a live terminator, sun and moon. Click anywhere to predict passes overhead with a sky plot, and scrub or fast-forward a 48-hour timeline.
47 Suminagashi
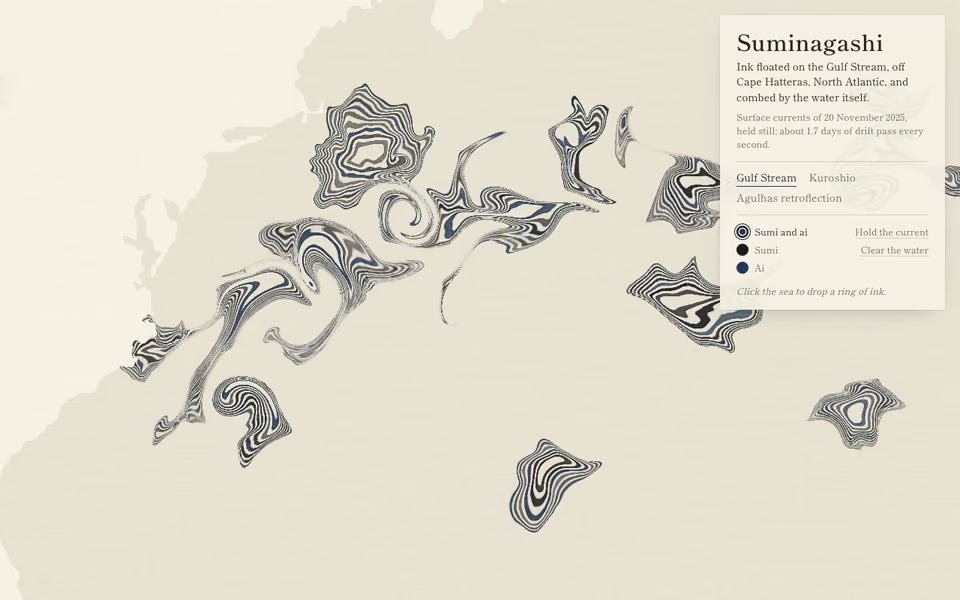
Marbled paper made by the ocean. Rings of sumi and indigo are floated on the real surface currents of the Gulf Stream, the Kuroshio and the Agulhas, and combed into marbling on the GPU. Click the sea to drop more ink.
48 Earth, yesterday
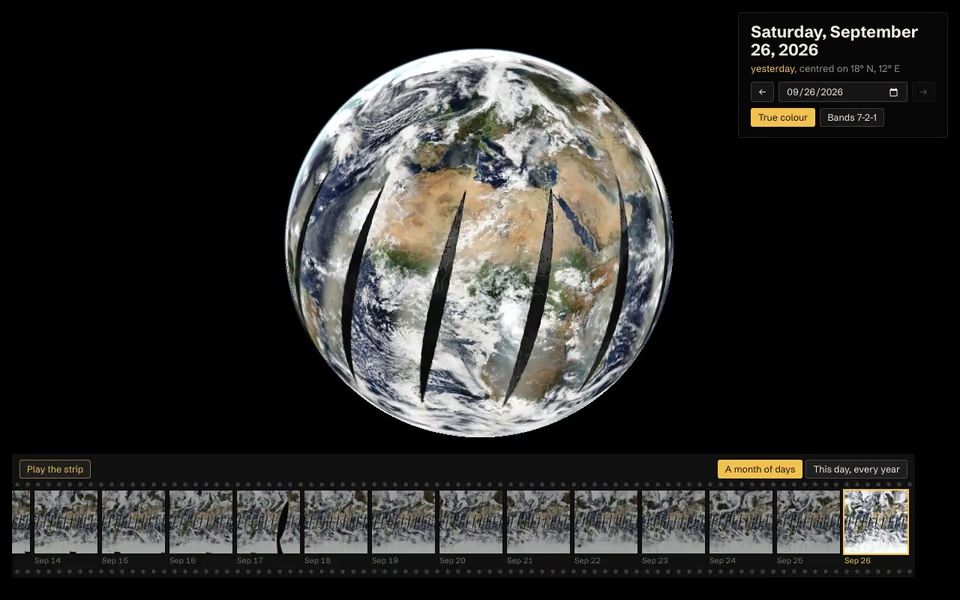
The whole planet as NASA's Terra satellite saw it yesterday, or any day since February 2000. A contact sheet of daily frames runs along the bottom; play it as a flipbook to watch a month of weather, or line up the same day across twenty-five years.
49 Pilot chart
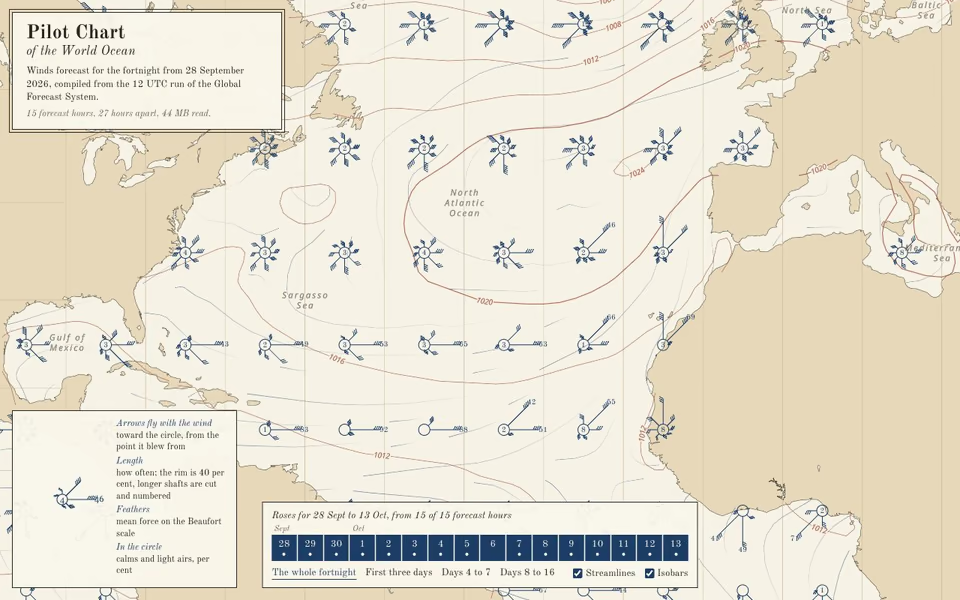
A navy pilot chart of the coming fortnight rather than of the average month: wind roses in every five-degree square, compiled in the browser from the latest GFS run's 16-day forecast.
50 Transit loom
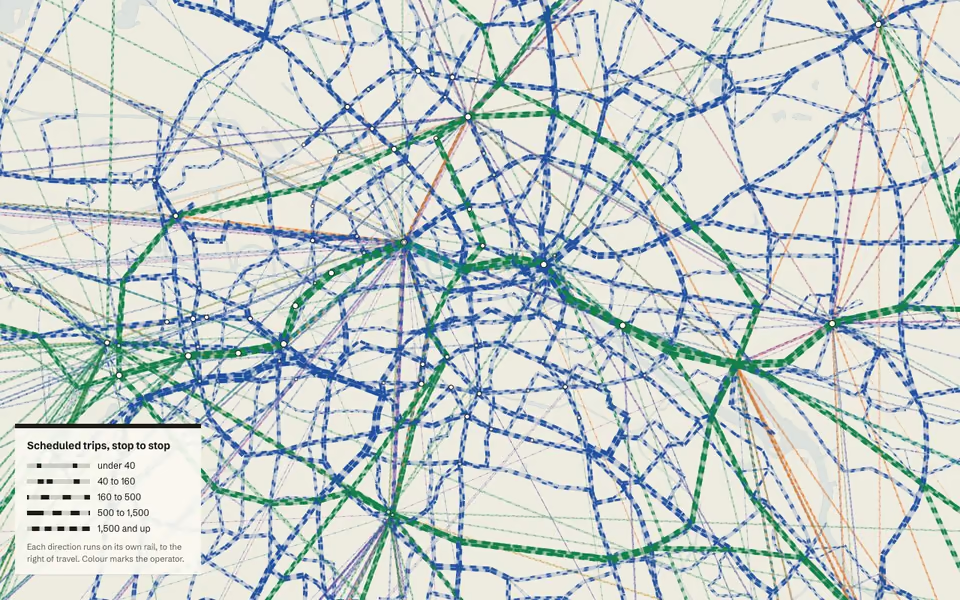
Stop-to-stop links from the Mobility Database GTFS feeds, drawn as a Vignelli diagram on vellum. Line weight is scheduled service and the dashes travel at a pace set by it, so the trunks of Berlin pulse while the outer branches barely stir.
51 Legend study
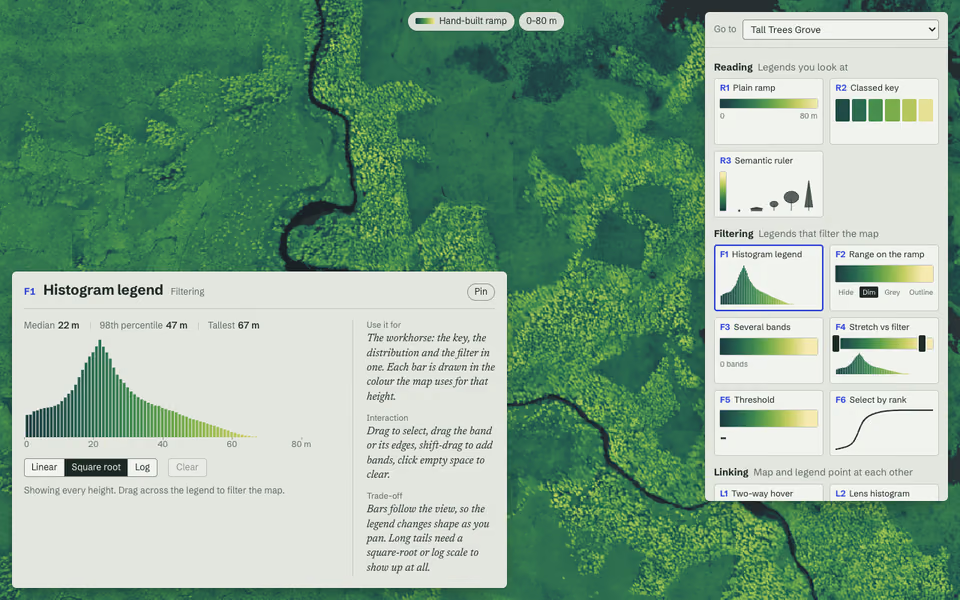
Twenty ways to build a map legend, all wired to one canopy height map. Brush a histogram, split the map between two legends, read a legend made of the tallest trees in view or redraw the colormap: every legend shares one state, and deck.gl-raster applies each change on the GPU without refetching a tile.
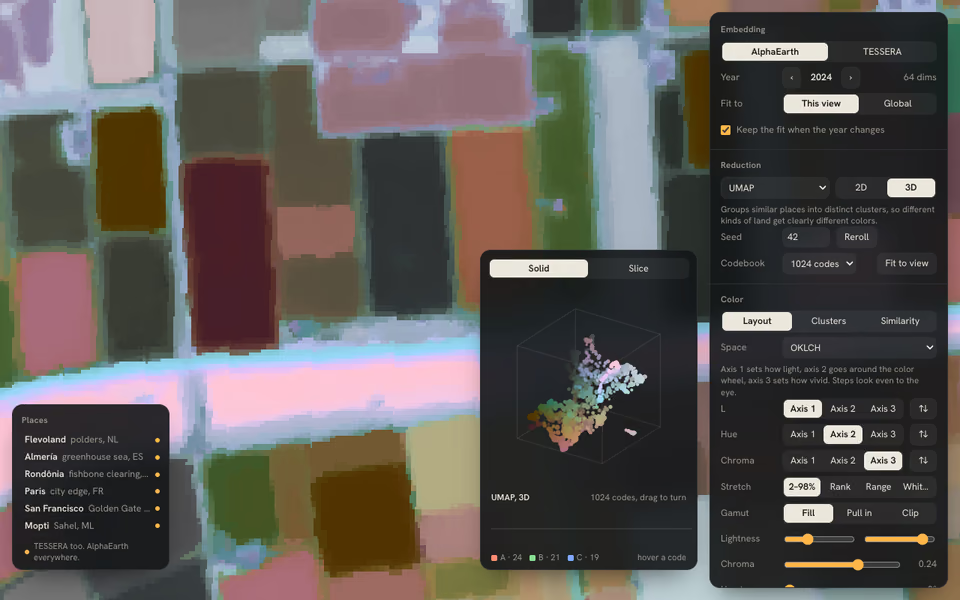
52 Latent color
Satellite embeddings (AlphaEarth and TESSERA) folded from 64 or 128 dimensions into three and poured into a colorspace, live in the browser: pick the reduction (UMAP to small neural nets trained on the spot), the seed, the space, the gamut and the anchors, fitted to the view or to a worldwide sample. Export any area as JPEG, WebP, AVIF, PNG or GeoTIFF.